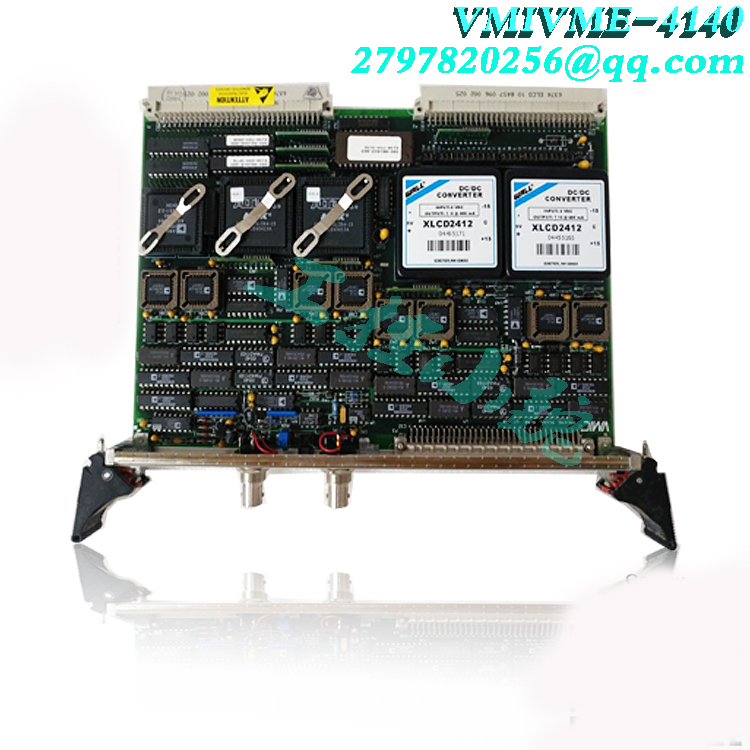
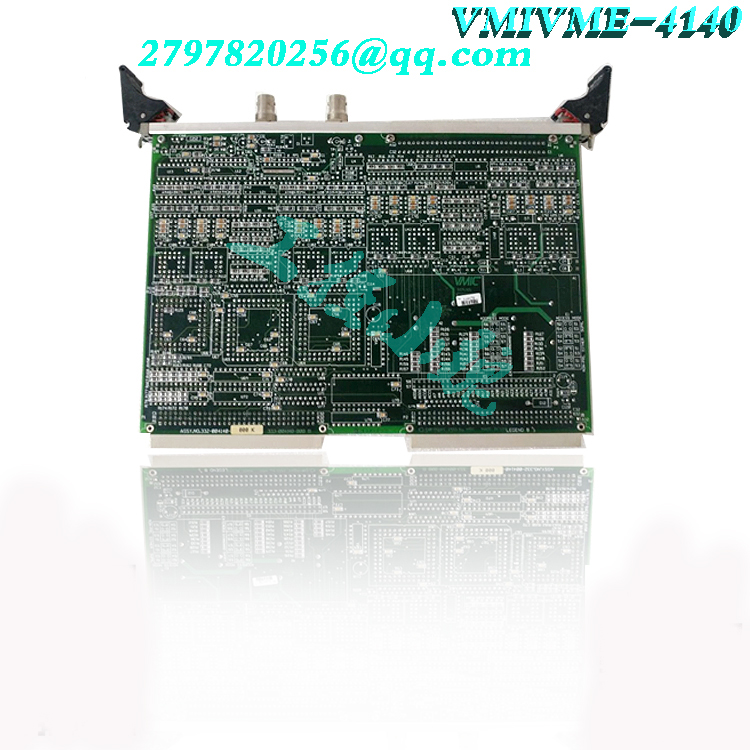
Description
summary DIASYS Netmation is used as the control system for liquefied natural gas (LNG) transport ships, which centrally controls and monitors the loading, transportation, and unloading of goods (in the freight department), as well as various stages such as turbines and boilers (in the engine department), forming the ship’s propulsion system. By utilizing high system performance and years of accumulated professional knowledge in shipyards, we help liquefied natural gas transport ships achieve energy-saving operation and ensure the safe transportation of liquefied natural gas.

.jpg)
graphic display
The graphical function displays the operating status of the device.
It can display the entire facility or part of the system diagram, real-time display of process status and process values. Support multi screen display for efficient operation.

In addition, relevant control circuit boards and logic screens associated with the devices displayed on the system screen can also be displayed to support operations. Call up the ring plate
You can call the loop board (final control element) from objects on the graphics screen to achieve real-time control. Call logic table
The relevant control logic can be called from the graphics and buttons on the graphics screen to confirm the details. Graph call (system diagram)
By registering other graphics with the button on the graphics display, the relevant graphics can be called up. Control circuit board
The control circuit board provides device monitoring or control on the device screen.
Control screen
Up to eight related control boards can be managed on one control screen
The control circuit board allows for operations such as modifying set values or performing open and close operations. Due to pressing the execute button after the input operation before outputting the control action, it can prevent misoperation. Alarm display
DIASYS Netmation alarms can quickly communicate abnormal conditions in the factory or control and monitoring systems to operators. The alarm can be configured with a 15 level priority and can accumulate and view up to 160000 generated event data.
Of course, the logic related to the triggered alarm can be immediately invoked to help identify the cause. Trend display
This feature displays process changes in graphical format.
Trend display allows process data to be registered on the screen through simple drag and drop operations.
There are three types of trends that can perform various analyses: trend graphs that monitor process data in chronological order, XY trends that display correlations between process data, and fast trends that display simple process data monitoring.
Model recommendation:


Kandi –
Wow, awesome blog layout! How lengthy have you been running a blog for?
you made blogging glance easy. The whole glance of your web site is great, let alone the content!
You can see similar: e-commerce and here sklep online
Here is my blog post: najlepszy sklep
admin –
Dear friend, thank you for your recognition. If you have any needs, you can consult the following address information
Address: Lvling Road, Siming District, Xiamen City, Fujian Province
QQ email: xiongbacarrey@qq.com
Industrial Control Sales Consultant: Carrey
WhatsApp:+86 18030177759
Skype ID: live: Cid Ca9e00ef3ecc00c4
Official website: https://www.weikunfadacai1.com/
Greetings&Thanks